Air Pollution
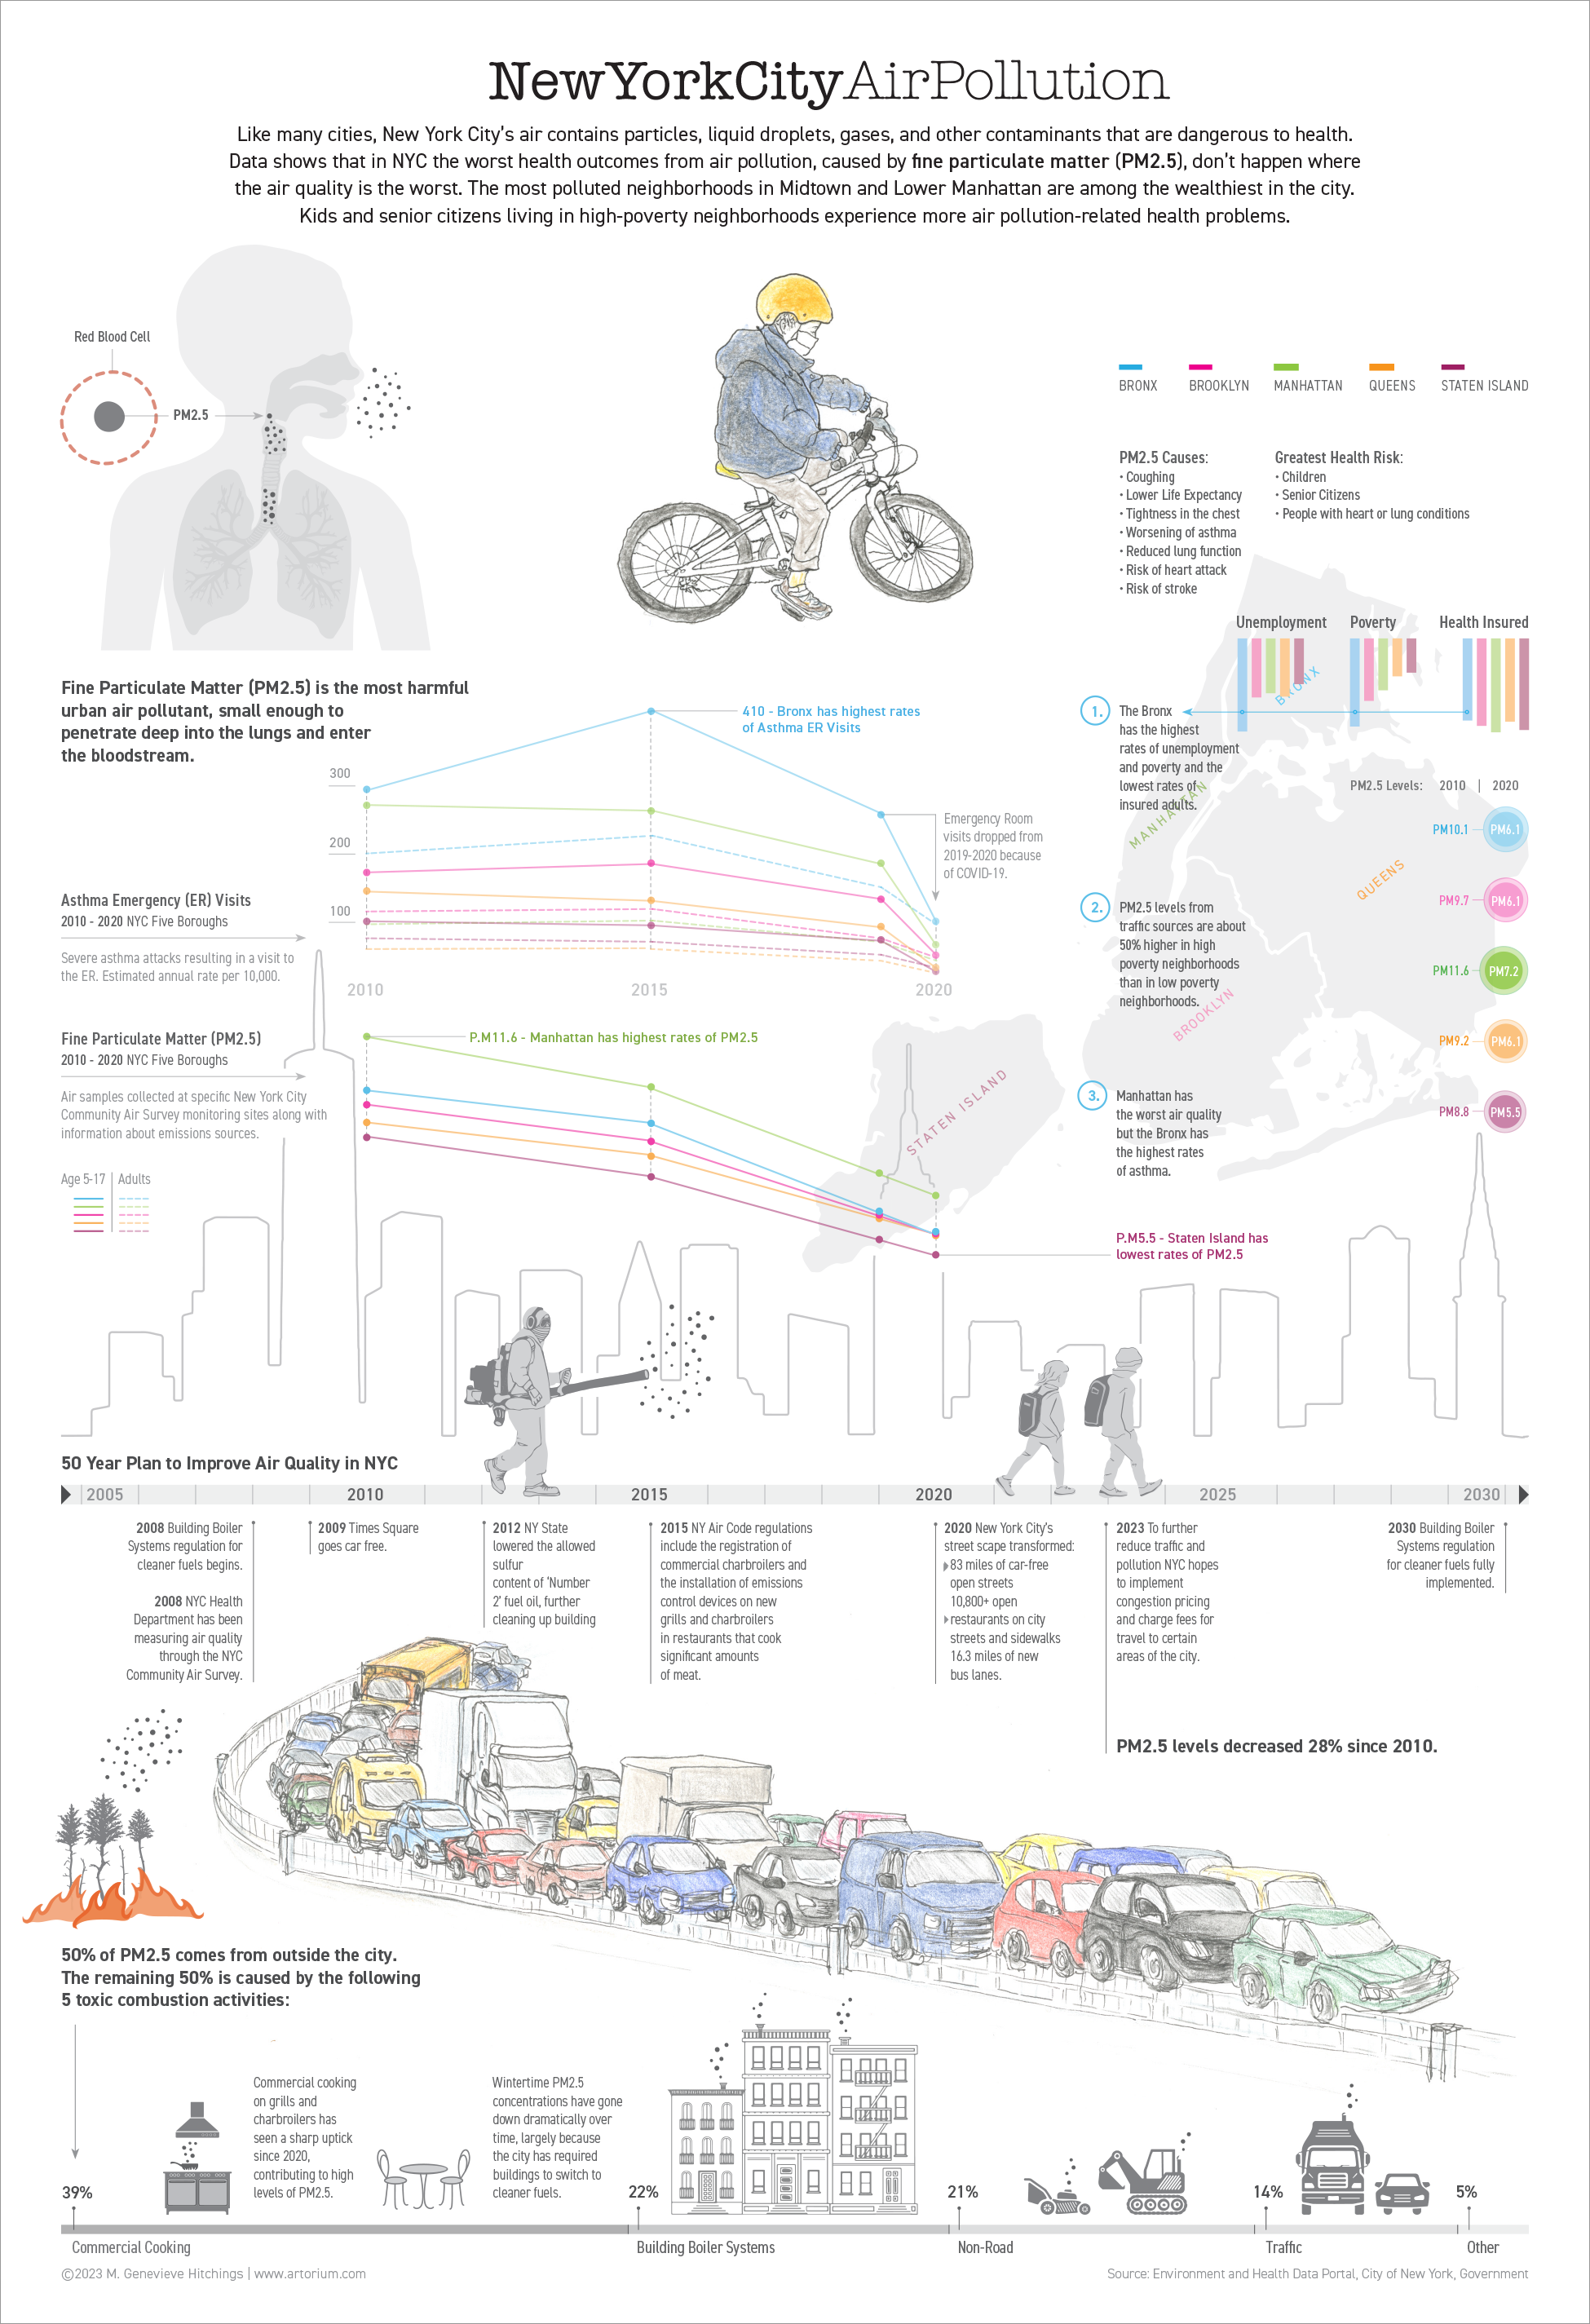
Using data collected from the Environment and Health Data Portal the infographic compares PM2.5 levels in NYC over the past 10 years with Asthma-related Emergency department visits. The data shows bad air quality affects people in poor neighborhoods the most even though the worst air quality is centralized in wealthier parts of the City.
Responsible For
Illustration and Design
